One console for a fleet of AI products
A growing set of AI products, agents and client deployments ran across separate hosts, model providers and repositories, with no single view of status, cost or work in progress.
My contribution
Defined the daily operating needs, shaped the product catalogue and cost views, designed the integrations, and built the console. Added cost attribution through Langfuse, a finance panel that brings in Folio banking and Fiken bookkeeping, and a dev panel connected to Claude Code so work is synced, claimed and started from the dashboard. Deployed the product and refined it through daily use.
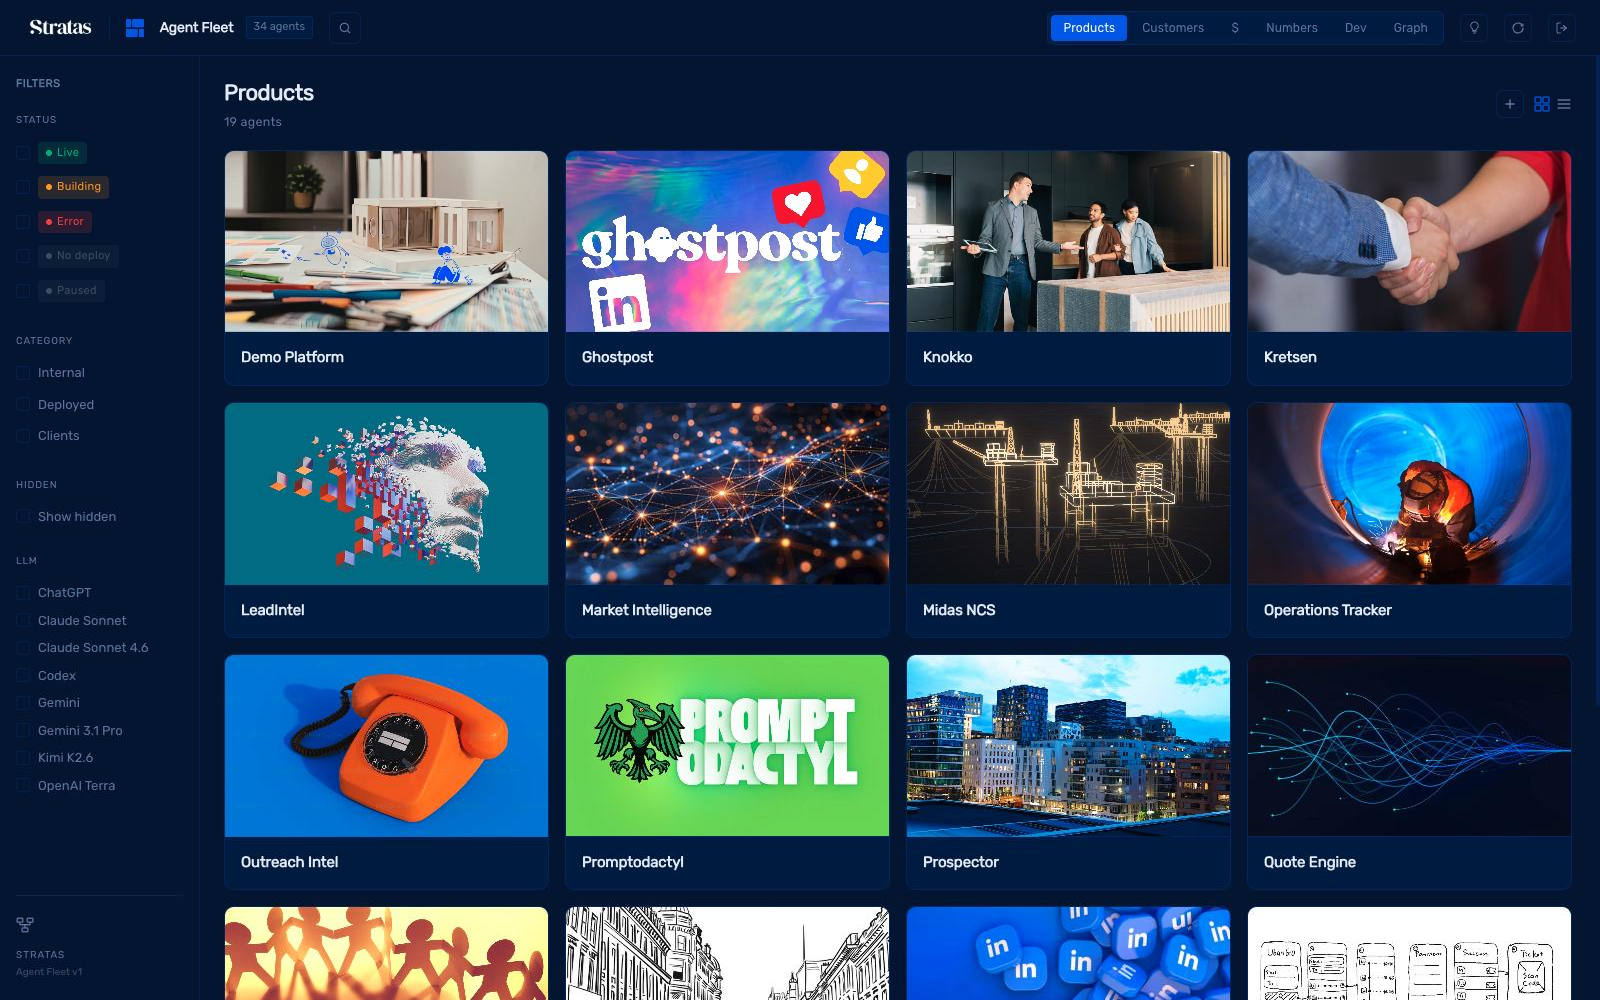
Key decision Build one operating console: a product catalogue with status and customers, cost attribution per product and model, finance in the same place, and the development backlog connected to the coding agents.
Outcome Runs Stratas operations daily: every product, deployment and cost in one view, with development work claimed and started from the dashboard.
 Open full-size image ↗
Situation
Stratas ships AI agent products for Nordic clients. As the fleet grew past ten products – some billed to clients, some internal – three problems compounded:
- Cost attribution went blurry. Anthropic, OpenAI, Firecrawl, Hunter, and Perplexity invoices arrived monthly with no per-product breakdown. A single overspend could go three weeks before anyone noticed.
- Operator context was fragmented. GitHub told us what was deploying, Vercel told us what was live, Langfuse told us what things cost, Supabase told us what was in production – and no one place told us all of that together.
- The customer boundary was invisible. Half the products were sold on markup to clients; half were internal ops. If the two views of the same cost data disagreed, someone was being overcharged or undercharged.
The prior state was a shared Google Sheet updated by hand once a month. It was already wrong by the time it was updated.
Task
Decide what a live operator console for an AI agent fleet has to be – and build it as the only surface the Stratas team open every morning, rather than one more dashboard that nobody consults after the first week.
The hard version of this decision: the dashboard had to earn its place against three plausible alternatives – a Notion database, a spreadsheet automation, or nothing at all. It only survives if it shows something the other three can't.
Action
System workflow
Architecture
Two-tier data flow. Bundled agents.json is the seed (and the fallback for preview deploys without env vars). Supabase holds operator edits that override the seed. A weekly GitHub Action re-syncs the seed from an Obsidian vault without wiping edits. Nothing requires all three layers to be live – every layer degrades cleanly.
Two-project Langfuse routing. Some products are billed to clients; some are internal. Each has its own Langfuse project. The dashboard reads the per-product langfuse_project field to route the read to the correct keypair (LANGFUSE_PUBLIC_KEY_CLIENT vs LANGFUSE_PUBLIC_KEY_STRATAS). If a product isn't in the catalog, its spend is silently nil – better to miss a new product than blend it into the wrong customer.
RLS deny-all with a two-user whitelist. No public policies on fleet_agents or fleet_agent_tasks. The Supabase auth callback verifies against a hardcoded two-address allowlist. This is a two-operator tool; multi-tenancy would be overengineering.
Alternatives considered and rejected:
- Notion database – no live Langfuse reads, no cost math, would rot.
- Ship it as a public SaaS – the RLS story and the marketing overhead were not worth 15 users we didn't have.
- Read from a single Langfuse project with tags – would have worked, but the client/stratas split is the boundary that matters most; encoding it in tags meant one careless call could silently misattribute revenue-adjacent cost.
Implementation
- Live spend under 500ms with a 5-minute cache on the Langfuse cost endpoint. This is the number that decides whether the dashboard is a daily habit or a monthly one.
- Reversible operator edits. Pencil-icon edits write to Supabase; the seed script never overwrites operator-owned fields. Sync-owned fields (source of truth in the vault) and operator-owned fields (source of truth in Supabase) are separated in the schema, not just in the UI.
- Two rollups from the same cost data.
usePerProductUsd()powers both the "per-agent" operator view and the "per-customer with markup" finance view. Any drift between the two would immediately mean someone's invoice is wrong. - Rate caps on the Insights chat. The dashboard has a Claude-powered chat against live cost data; it is capped at 50 calls/day per user and $20/day per workspace, with the cap enforced via a Langfuse tag filter. The AI feature has to be cheaper than the leak it's exposing.
Verification
- Every LLM call the dashboard makes is Langfuse-traced. The dashboard about itself is a first-class user of the cost data it displays.
- Daily use by the Stratas team is the truest test. The dashboard is Vercel deployment log #1 of the day; if it breaks, we notice within an hour.
- The seed script has a smoke path that re-runs from an empty Supabase and matches the current live view.
Result
 Open full-size image ↗
- Daily use by the operators. The dashboard is where the workday starts. When cost spikes happen (they have), they surface within a business day rather than in the next invoice.
- 13 products under a single catalog. Each with cost, model, service kind, and monthly USD reconciled between vault, code, and live spend.
- Zero misattribution incidents on the client/internal boundary since the two-project routing shipped. The failure mode we most feared has not occurred.
- ~9,000 lines across 77 source files + 13 API routes – small enough that any change is understood end-to-end by the operators.
Second-order effects: the dashboard became the coordinating artifact for every other product in the fleet. When a new product ships, the checklist is "does it appear in the fleet dashboard with cost wired?" – which forces per-product Langfuse tagging as a launch condition, which is why every new product gets cost instrumentation on day one rather than added later.
What we would do differently: ship the Activity Audit view in v1 rather than as a v2 roadmap item. The write path already logs structured audit rows; not exposing them in the UI meant six weeks of "was that us or you who bumped that rate?" that a two-column table would have answered.
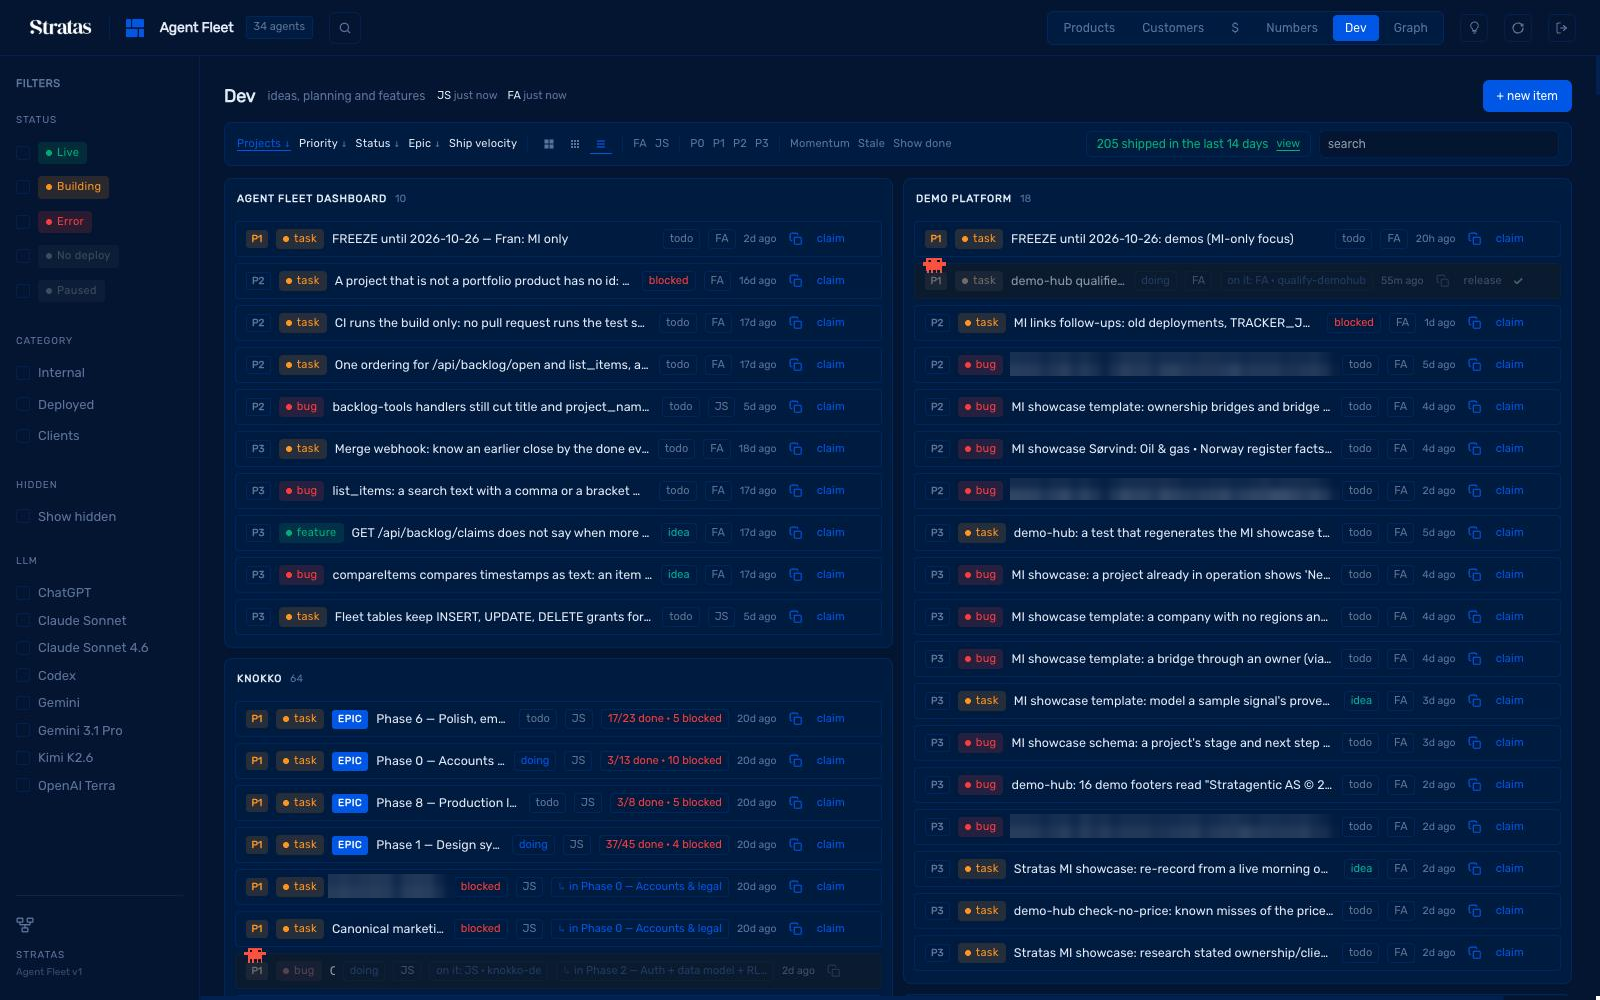
Follow-on (September 2026): Chapter II – Dev tab + shared build backlog – has moved to its own case study at 08-fleet-backlog-mcp.md. In short: fleet_backlog (migrations 0015–0021), one Postgres table with atomic claim RPC and holder guard, three write surfaces (dashboard, CLI, remote MCP server), shared across the operators and each operator's Claude Code sessions. Shipped 2026-09-24 in PR #130; became the operating backlog for the fleet within one working day.
Skills evidenced
- LLM cost instrumentation at product scale – every read routed to the correct Langfuse project, tag-based dispatch, silent-nil for unknown products.
- Supabase RLS as the security model – deny-all default, service-role for writes, no bespoke auth layer to break.
- Two-tier data with graceful degradation – bundled seed + live overrides + weekly sync; every layer works on its own.
- Serverless-native architecture – Vercel Node functions, deliberate Node-vs-Edge choice per route, daily cron for finance snapshots.
- Constraint discipline in the UI layer – Geist Mono aesthetic, no component framework, inline JSX + CSS variables; the design keeps out of the operator's way.
Portable lessons
- Dashboards earn their place by beating the alternative daily, not by being feature-complete. The competition for a fleet dashboard is a Google Sheet – win by being live, or lose by being another tab.
- The boundary that matters most (here: client-billed vs internal spend) belongs in the data plumbing, not in the display. Tags on shared data are one careless caller away from misattribution.
- Silent nil beats a wrong number. For any auto-detected artifact, the honest default is to omit until explicitly cataloged. This scales – a new product doesn't distort the fleet view until it earns its way into the catalog.
Want to discuss the decisions behind it?
Over fifteen years of consulting and growth, and hands-on AI delivery from discovery to daily operations. I can share my CV and talk through how I connect business outcomes with systems that run.
Available for a chat. In person in Stavanger, or remotely worldwide.